Visualizations
1D and 2D heat clustermap visualizations of binary trees
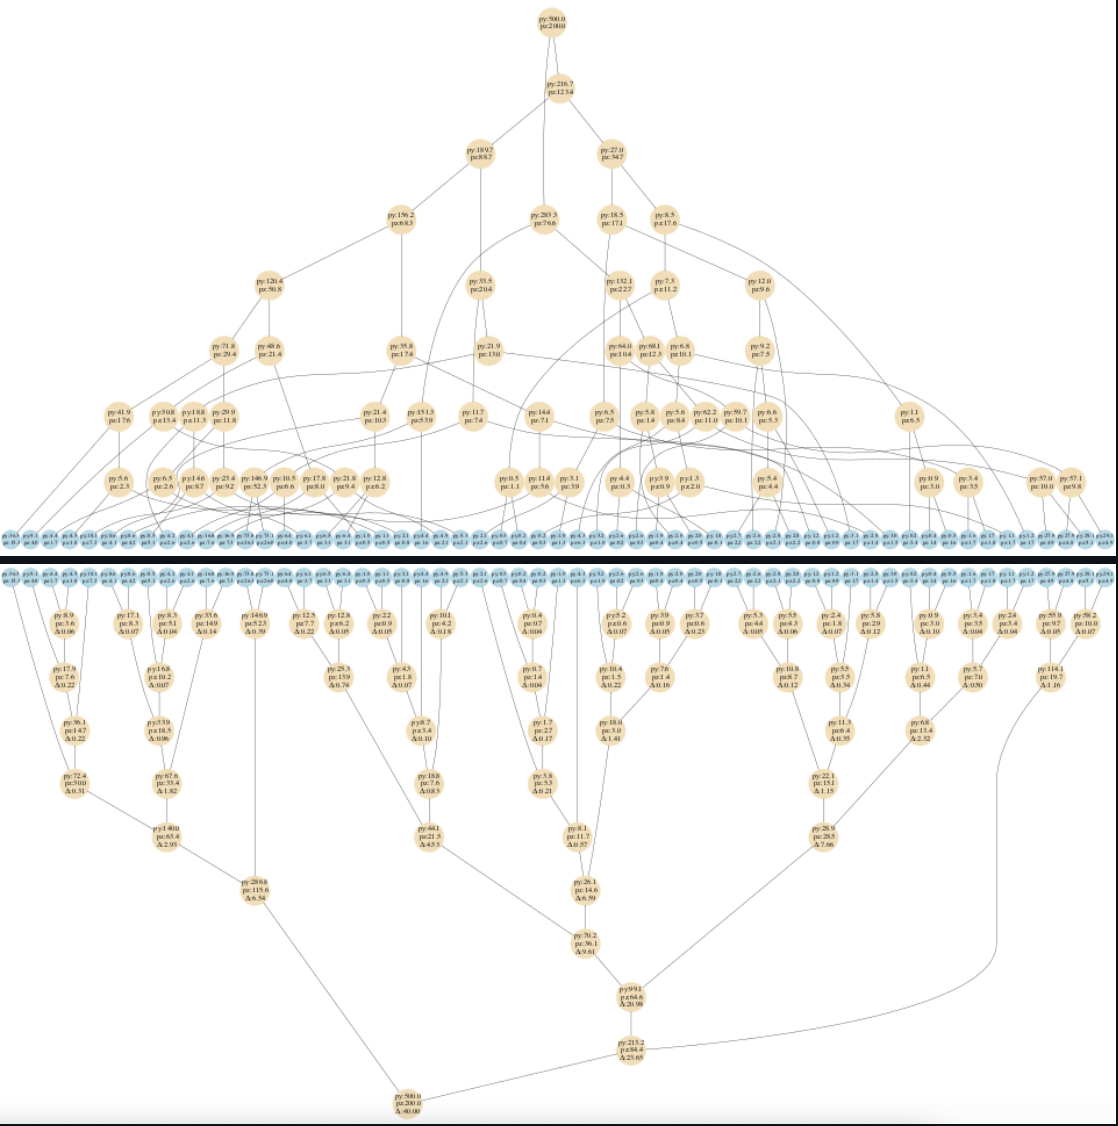
The visualization package for binary trees, VisualizeBinaryTrees, was developed for this project. There are two types of visualizations.
1D Tree-only visualizations
Given a tree structure, 1D tree-only plots of the tree (with nodes and edges).

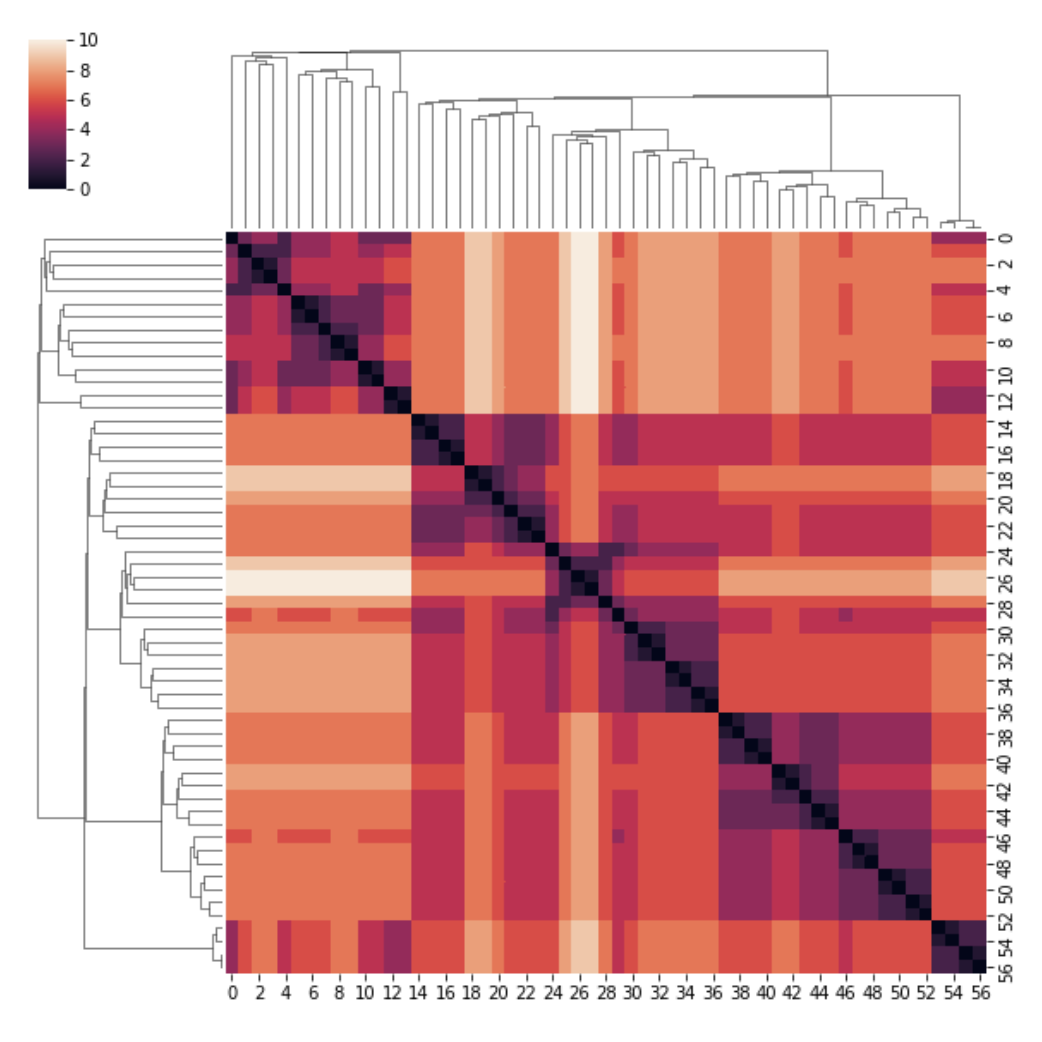
2D heat clustermaps visualizations
Given a tree structure, 2D heat clustermaps visualizations are created.
1) If only one tree is given as input, both rows and columns are ordered according to that tree.
2) If two trees, A and B are given as input, the visualization can show the heat data map of tree A, with columns ordered according to A and rows according to B or viceversa.
Given a pair of tree leaves {i,j} and the number of steps needed for each leaf to reach their closest common ancestor {S_i,S_j}, the heat map scale represents the maximum number of steps, i.e. max{S_i,S_j}.
